4. Visualizing tracks
0. Introduction
Once you have a tracking dataset ready, you can visualize it using the trajectory visualization app provided in the package. You can launch the app by typing the following command in the R console:
This will open the app launcher either in the viewer pane of RStudio and Positron, or in a separate window, depending on your local configuration. In RStudio at least, you can control where the app opens by setting the launch.browser option. For instance:
trackR(launch.browser = shiny::paneViewer())will launch the app in the RStudio viewer pane.
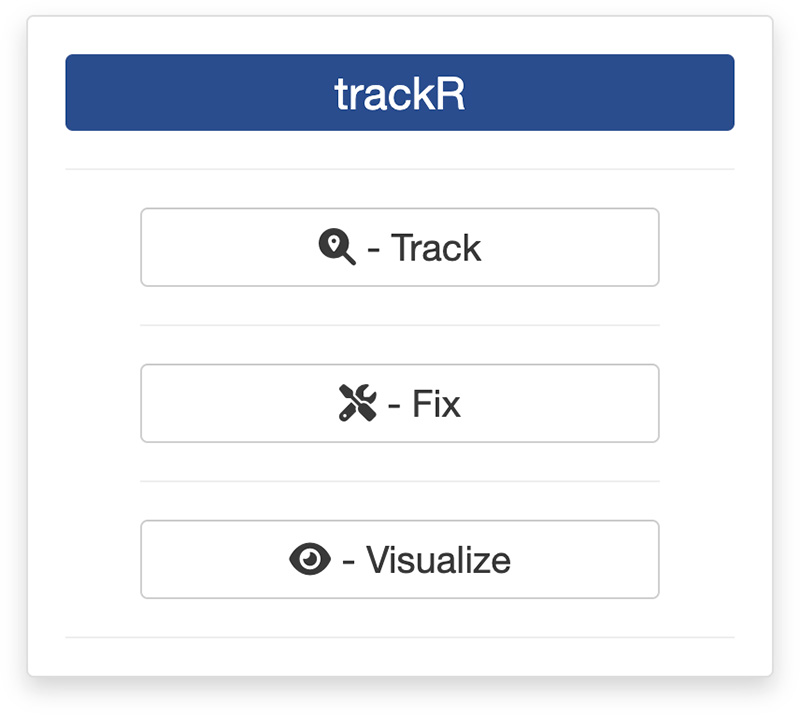
Once the launcher is running, click on the “Visualize” button to launch the visualization app. The launcher will close and the app will start shortly after.
1. Player module
The first step of the visualization process is to load a video file and the tracking data into the app. To do this, simply click the “Select video” button. This will bring up a navigator that you will use to locate the video file that you would like to track. Once you have located the video file in the navigator, click the “Select” button. The app` will open the video and display its first image in the display window (see below).
Repeat the process with “Select tracks” button to load the tracking data. Once this is done, the tracked objects should be indicated by a colored box with a number corresponding to their tracked identity (see below).
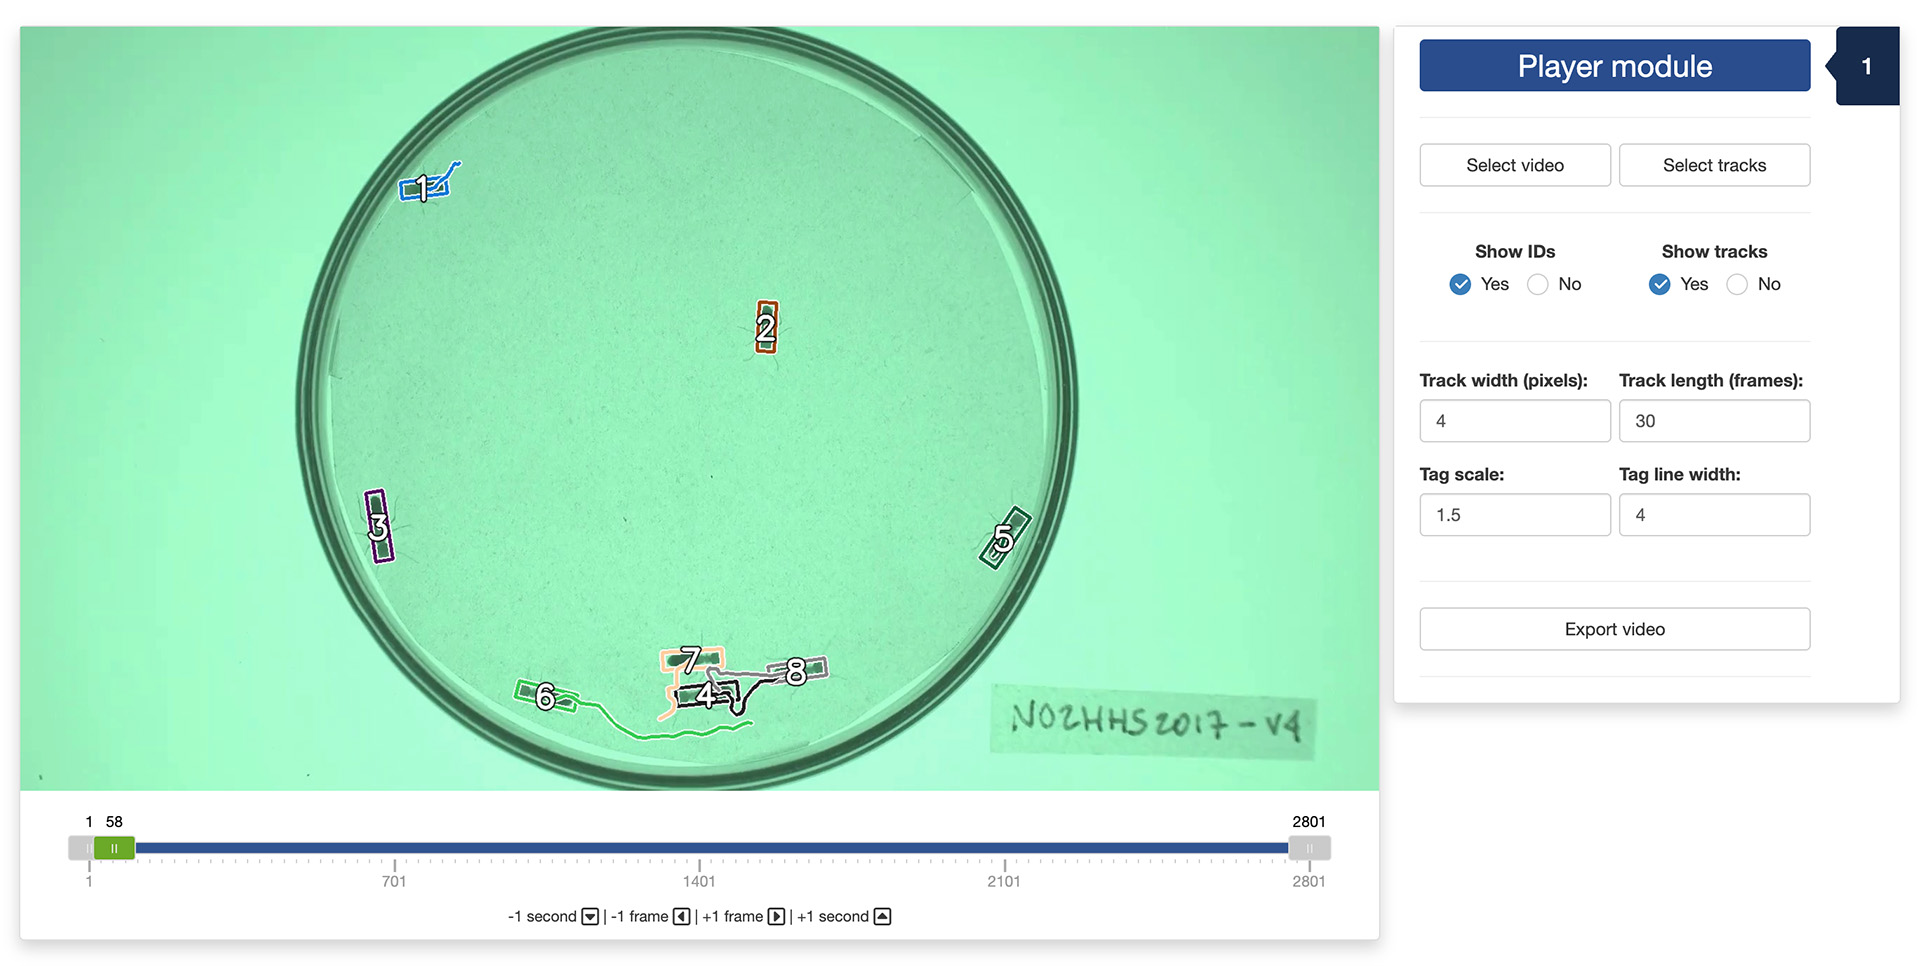
You can navigate through the video by sliding the green tab along the timeline displayed below the video. You can also use the arrow keys on your keyboard to navigate through the video: the left and right arrows allow you to navigate frame by frame; the up and down arrows allow you to navigate one second at a time.
Below the navigation controls, you will find four numeric input fields:
“Track width (pixels)” allows you to adjust the width of the lines delineating the tracked objects and representing their trajectories;
“Track length (frames)” allows you to adjust the number of frames used to represent the trajectories of the tracked objects;
“Tag scale” allows you to adjust the font size of the tags that represent the identities of the tracked objects;
“Tag line width” allows you to adjust the font thickness of the tags.
Below the input fields, you will find four tick boxes that will allow you to show/hide the ID number or the class of each object, the colored boxes delineating them, and the trajectories that the tracked objects have taken during a fixed number of frames.
Finally, at the very bottom of the app window, the “Export video” button allows you to export the video with the tracked objects superimposed on it. After clicking this button, the app will prompt you to select a location to save the exported video. Once this is done, the export will start and the video will be saved in the selected location.
The video used throughout this tutorial was provided by Sridhar, V. H., Roche, D. G., and Gingins, S. (2019). Tracktor: Image-based automated tracking of animal movement and behaviour. Methods Ecol. Evol. 10, 691. doi:10.1111/2041-210X.13166 and used here with permission of the authors.