cec performs Cross-Entropy Clustering on a data matrix.
See Details for an explanation of Cross-Entropy Clustering.
Usage
cec(
  x,
  centers,
  type = c("covariance", "fixedr", "spherical", "diagonal", "eigenvalues", "mean", "all"),
  iter.max = 25,
  nstart = 1,
  param,
  centers.init = c("kmeans++", "random"),
  card.min = "5%",
  keep.removed = FALSE,
  interactive = FALSE,
  threads = 1,
  split = FALSE,
  split.depth = 8,
  split.tries = 5,
  split.limit = 100,
  split.initial.starts = 1,
  readline = TRUE
)
Arguments
- x
A numeric matrix of data. Each row corresponds to a distinct observation; each column corresponds to a distinct variable/dimension. It must not contain
NAvalues.- centers
Either a matrix of initial centers or the number of initial centers (
k, single numbercec(data, 4, ...)) or a vector for variable number of centers (cec(data, 3:10, ...)). It must not containNAvalues.If
centersis a vector,length(centers)clusterings will be performed for each start (nstartargument) and the total number of clusterings will belength(centers) * nstart.If
centersis a number or a vector, initial centers will be generated using a method depending on thecenters.initargument.- type
The type (or types) of clustering (density family). This can be either a single value or a vector of length equal to the number of centers. Possible values are: "covariance", "fixedr", "spherical", "diagonal", "eigenvalues", "all" (default).
Currently, if the
centersargument is a vector, only a single type can be used.- iter.max
The maximum number of iterations of the clustering algorithm.
- nstart
The number of clusterings to perform (with different initial centers). Only the best clustering (with the lowest cost) will be returned. A value grater than 1 is valid only if the
centersargument is a number or a vector.If the
centersargument is a vector,length(centers)clusterings will be performed for each start and the total number of clusterings will belength(centers) * nstart.If the split mode is on (
split = TRUE), the whole procedure (initial clustering + split) will be performednstarttimes, which may take some time.- param
The parameter (or parameters) specific to a particular type of clustering. Not all types of clustering require parameters. The types that require parameter are: "covariance" (matrix parameter), "fixedr" (numeric parameter), "eigenvalues" (vector parameter). This can be a vector or a list (when one of the parameters is a matrix or a vector).
- centers.init
The method used to automatically initialize the centers. Possible values are: "kmeans++" (default) and "random".
- card.min
The minimal cluster cardinality. If the number of observations in a cluster becomes lower than card.min, the cluster is removed. This argument can be either an integer number or a string ending with a percent sign (e.g. "5%").
- keep.removed
If this parameter is TRUE, the removed clusters will be visible in the results as NA in the "centers" matrix (as well as the corresponding values in the list of covariances).
- interactive
If
TRUE, the result of clustering will be plotted after every iteration.- threads
The number of threads to use or "auto" to use the default number of threads (usually the number of available processing units/cores) when performing multiple starts (
nstartparameter).The execution of a single start is always performed by a single thread, thus for
nstart = 1only one thread will be used regardless of the value of this parameter.- split
If
TRUE, the function will attempt to discover new clusters after the initial clustering, by trying to split single clusters into two and check whether it lowers the cost function.For each start (
nstart), the initial clustering will be performed and then splitting will be applied to the results. The number of starts in the initial clustering before splitting is driven by thesplit.initial.startsparameter.- split.depth
The cluster subdivision depth used in split mode. Usually, a value lower than 10 is sufficient (when after each splitting, new clusters have similar sizes). For some data, splitting may often produce clusters that will not be split further, in that case a higher value of
split.depthis required.- split.tries
The number of attempts that are made when trying to split a cluster in split mode.
- split.limit
The maximum number of centers to be discovered in split mode.
- split.initial.starts
The number of 'standard' starts performed before starting the splitting process.
- readline
Used only in the interactive mode. If
readlineis TRUE, at each iteration, before plotting it will wait for the user to press <Return> instead of the standard 'before plotting' waiting (graphics::par(ask = TRUE)).
Value
An object of class cec with the following attributes:
data, cluster, probability, centers,
cost.function, nclusters, iterations, cost,
covariances, covariances.model, time.
Details
Cross-Entropy Clustering (CEC) aims to partition m points into k clusters so as to minimize the cost function (energy E of the clustering) by switching the points between clusters. The presented method is based on the Hartigan approach, where we remove clusters which cardinalities decreased below some small prefixed level.
The energy function E is given by:
$$E(Y_1,\mathcal{F}_1;...;Y_k,\mathcal{F}_k) = \sum\limits_{i=1}^{k} p(Y_i) \cdot (-ln(p(Y_i)) + H^{\times}(Y_i\|\mathcal{F}_i))$$
where Yi denotes the i-th cluster, p(Yi) is the ratio of the number of points in i-th cluster to the total number points, H(Yi|Fi) is the value of cross-entropy, which represents the internal cluster energy function of data Yi defined with respect to a certain Gaussian density family Fi, which encodes the type of clustering we consider.
The value of the internal energy function H depends on the covariance matrix (computed using maximum-likelihood) and the mean (in case of the mean model) of the points in the cluster. Seven implementations of H have been proposed (expressed as a type - model - of the clustering):
- "all":
All Gaussian densities. Data will form ellipsoids with arbitrary radiuses.
- "covariance":
Gaussian densities with a fixed given covariance. The shapes of clusters depend on the given covariance matrix (additional parameter).
- "fixedr":
Special case of 'covariance', where the covariance matrix equals rI for the given r (additional parameter). The clustering will have a tendency to divide data into balls with approximate radius proportional to the square root of r.
- "spherical":
Spherical (radial) Gaussian densities (covariance proportional to the identity). Clusters will have a tendency to form balls of arbitrary sizes.
- "diagonal":
Gaussian densities with diagonal covariane. Data will form ellipsoids with radiuses parallel to the coordinate axes.
- "eigenvalues":
Gaussian densities with covariance matrix having fixed eigenvalues (additional parameter). The clustering will try to divide the data into fixed-shaped ellipsoids rotated by an arbitrary angle.
- "mean":
Gaussian densities with a fixed mean. Data will be covered with ellipsoids with fixed centers.
The implementation of cec function allows mixing of clustering types.
References
Spurek, P. and Tabor, J. (2014) Cross-Entropy Clustering Pattern Recognition 47, 9 3046–3059
Examples
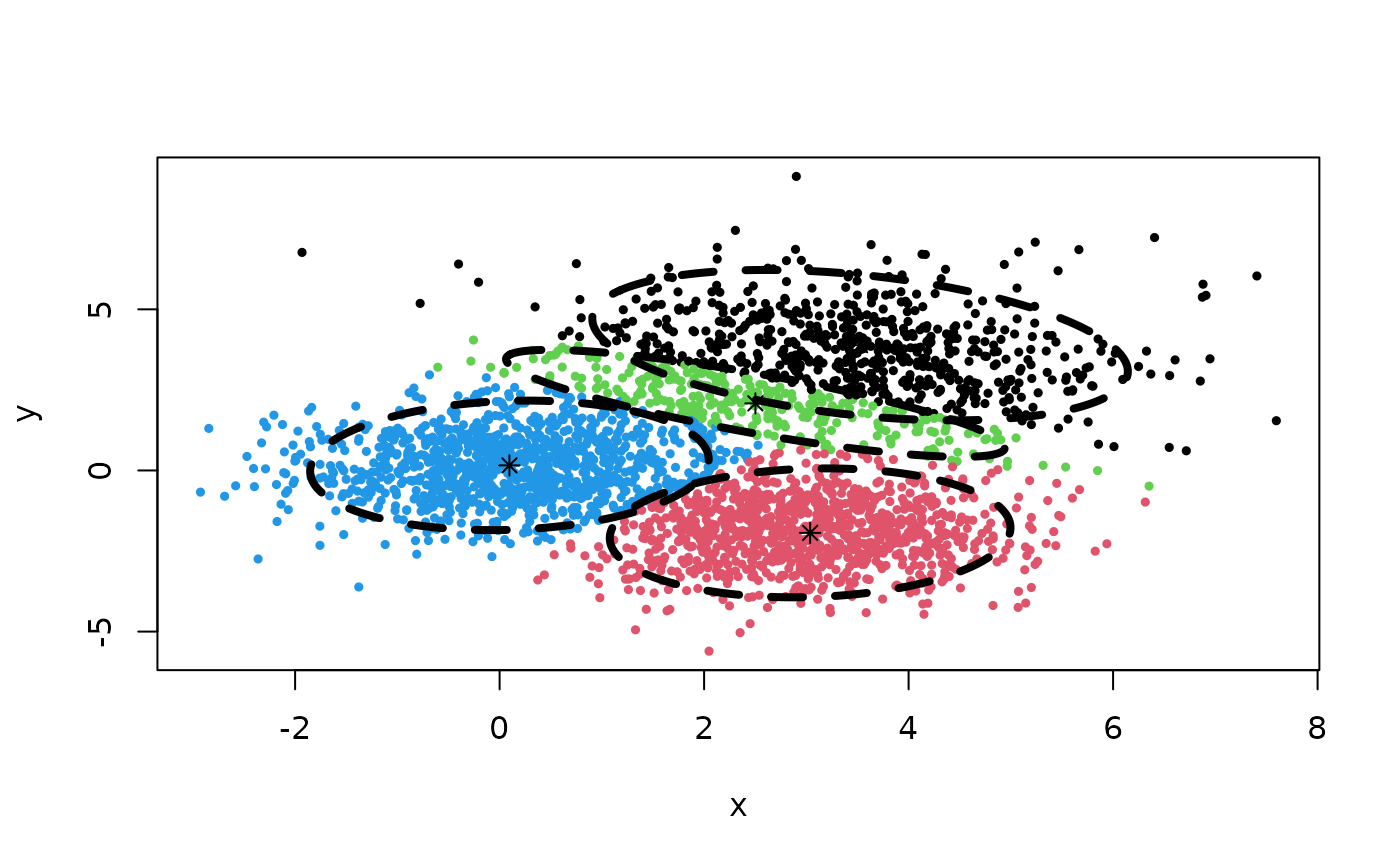
## Example of clustering a random data set of 3 Gaussians, with 10 random
## initial centers and a minimal cluster size of 7% of the total data set.

m1 <- matrix(rnorm(2000, sd = 1), ncol = 2)
m2 <- matrix(rnorm(2000, mean = 3, sd = 1.5), ncol = 2)
m3 <- matrix(rnorm(2000, mean = 3, sd = 1), ncol = 2)
m3[,2] <- m3[, 2] - 5
m <- rbind(m1, m2, m3)

plot(m, cex = 0.5, pch = 19)


## Clustering result:
Z <- cec(m, 10, iter.max = 100, card.min = "7%")
plot(Z)


# Result:
Z
#> CEC clustering result:
#>
#> Probability vector:
#> [1] 0.3400000 0.3176667 0.3423333
#>
#> Means of clusters:
#>             [,1]         [,2]
#> [1,] -0.02245741 -0.004858236
#> [2,]  3.12679992  3.098052176
#> [3,]  3.08094336 -1.968972040
#>
#> Cost function:
#> [1] 4.088558
#>
#> Number of clusters:
#> [1] 3
#>
#> Number of iterations:
#> [1] 40
#>
#> Computation time:
#> NULL
#>
#> Available components:
#>  [1] "data"              "cluster"           "probabilities"
#>  [4] "centers"           "cost.function"     "nclusters"
#>  [7] "iterations"        "covariances"       "covariances.model"
#> [10] "time"

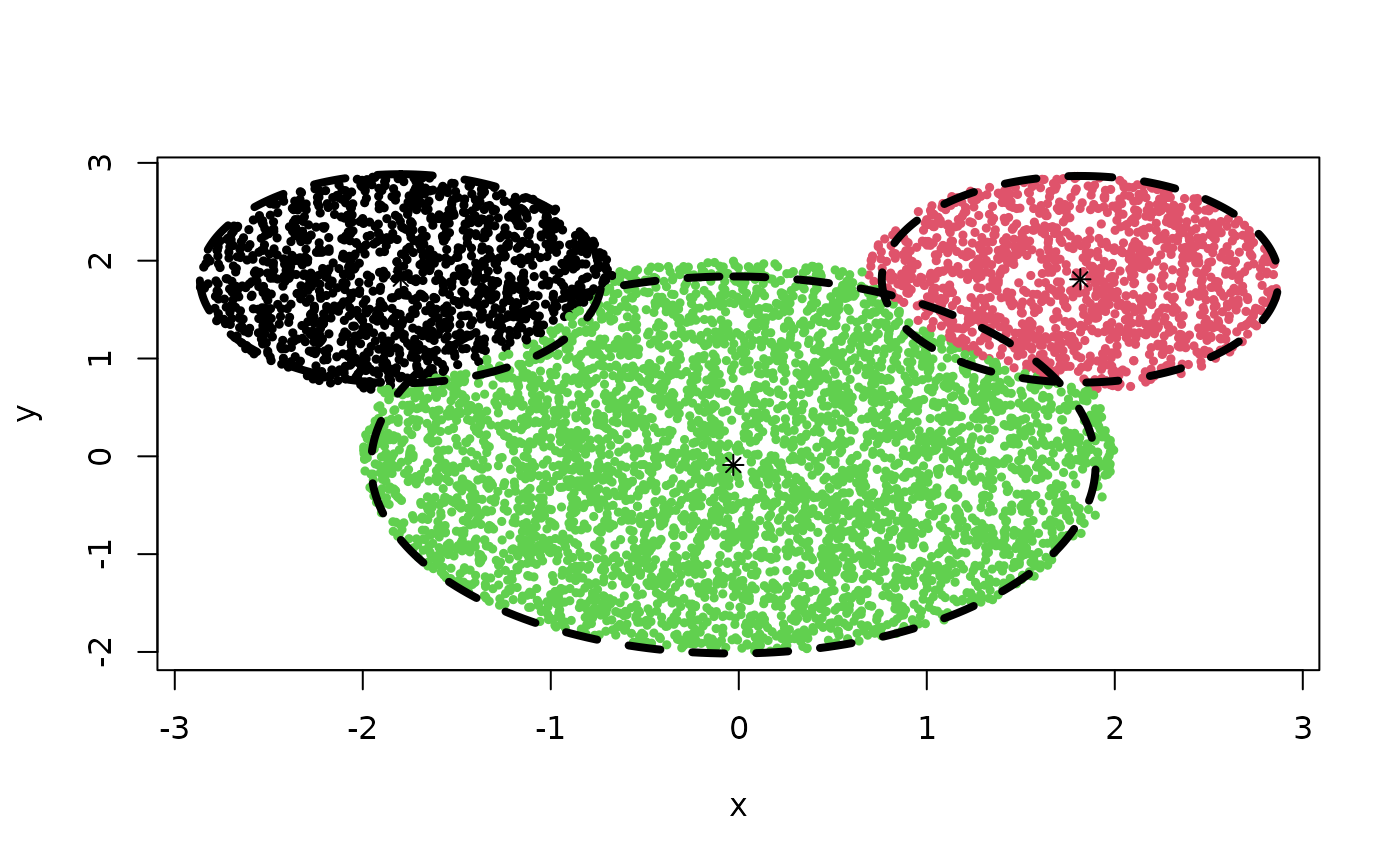
## Example of clustering mouse-like set using spherical Gaussian densities.
m <- mouseset(n = 7000, r.head = 2, r.left.ear = 1.1, r.right.ear = 1.1,
left.ear.dist = 2.5, right.ear.dist = 2.5, dim = 2)
plot(m, cex = 0.5, pch = 19)

## Clustering result:
Z <- cec(m, 3, type = 'sp', iter.max = 100, nstart = 4, card.min = '5%')
plot(Z)

# Result:
Z
#> CEC clustering result:
#>
#> Probability vector:
#> [1] 0.1785714 0.1917143 0.6297143
#>
#> Means of clusters:
#>             [,1]       [,2]
#> [1,] -1.82202429  1.8198672
#> [2,]  1.79376569  1.8358197
#> [3,]  0.01245875 -0.1000735
#>
#> Cost function:
#> [1] 3.239522
#>
#> Number of clusters:
#> [1] 3
#>
#> Number of iterations:
#> [1] 8
#>
#> Computation time:
#> NULL
#>
#> Available components:
#>  [1] "data"              "cluster"           "probabilities"
#>  [4] "centers"           "cost.function"     "nclusters"
#>  [7] "iterations"        "covariances"       "covariances.model"
#> [10] "time"

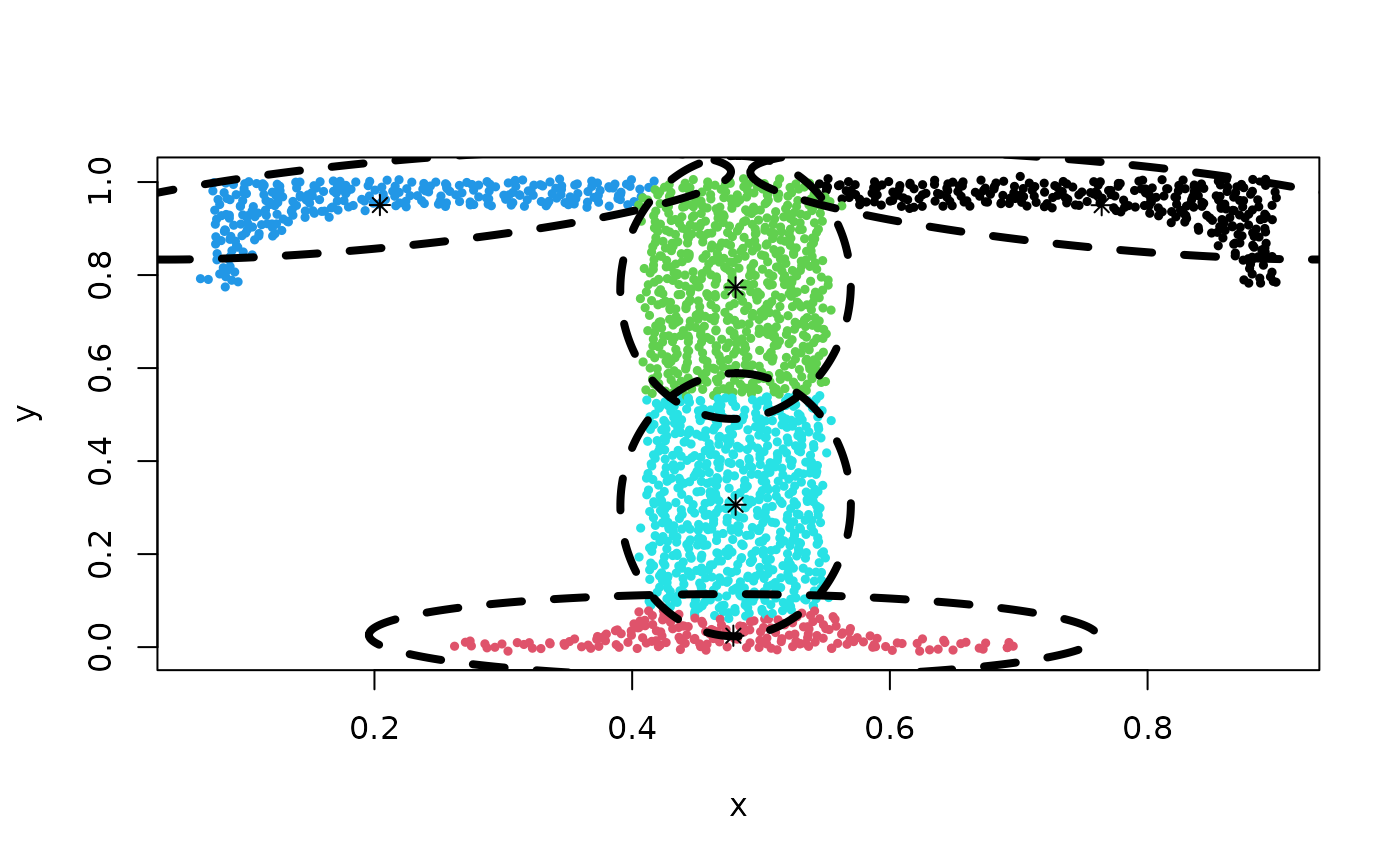
## Example of clustering data set 'Tset' using 'eigenvalues' clustering type.
data(Tset)
plot(Tset, cex = 0.5, pch = 19)

centers <- init.centers(Tset, 2)
## Clustering result:
Z <- cec(Tset, 5, 'eigenvalues', param = c(0.02, 0.002), nstart = 4)
plot(Z)

# Result:
Z
#> CEC clustering result:
#>
#> Probability vector:
#> [1] 0.13556086 0.09355609 0.13937947 0.31789976 0.31360382
#>
#> Means of clusters:
#>           [,1]       [,2]
#> [1,] 0.2042192 0.95055618
#> [2,] 0.4785275 0.02452337
#> [3,] 0.7643719 0.95023375
#> [4,] 0.4802873 0.30611503
#> [5,] 0.4802300 0.77350819
#>
#> Cost function:
#> [1] -0.965621
#>
#> Number of clusters:
#> [1] 5
#>
#> Number of iterations:
#> [1] 8
#>
#> Computation time:
#> NULL
#>
#> Available components:
#>  [1] "data"              "cluster"           "probabilities"
#>  [4] "centers"           "cost.function"     "nclusters"
#>  [7] "iterations"        "covariances"       "covariances.model"
#> [10] "time"

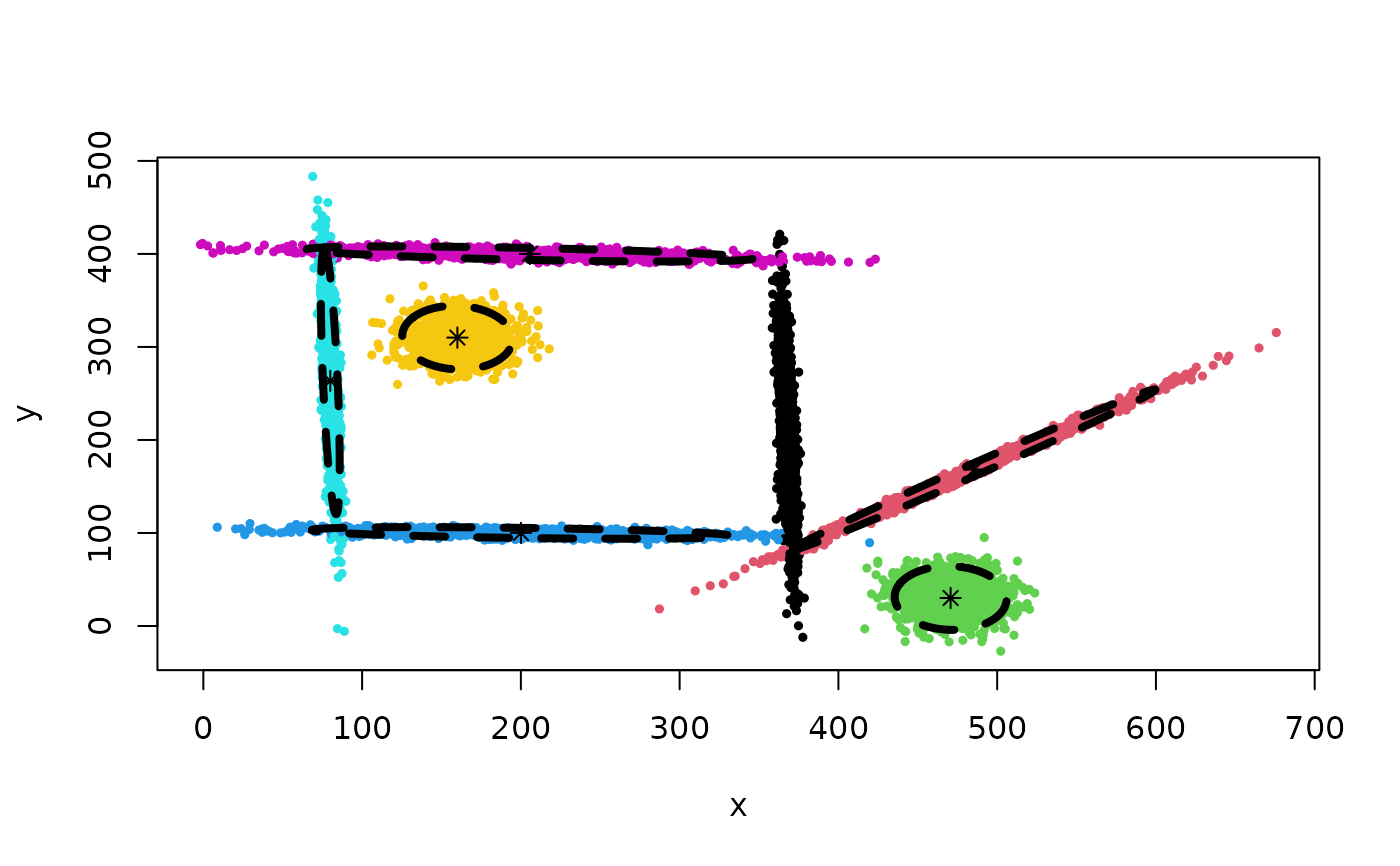
## Example of using cec split method starting with a single cluster.
data(mixShapes)
plot(mixShapes, cex = 0.5, pch = 19)

## Clustering result:
Z <- cec(mixShapes, 1, split = TRUE)
plot(Z)

# Result:
Z
#> CEC clustering result:
#>
#> Probability vector:
#> [1] 0.1427778 0.1435556 0.1450000 0.1401111 0.1404444 0.1427778 0.1453333
#>
#> Means of clusters:
#>           [,1]      [,2]
#> [1,] 368.08445 203.08078
#> [2,] 485.59620 168.18558
#> [3,] 160.00748 310.04231
#> [4,] 205.68965 399.95641
#> [5,] 470.67809  30.09067
#> [6,] 200.07333 100.05577
#> [7,]  79.96403 263.55175
#>
#> Cost function:
#> [1] 10.14958
#>
#> Number of clusters:
#> [1] 7
#>
#> Number of iterations:
#> [1] 3
#>
#> Computation time:
#> NULL
#>
#> Available components:
#>  [1] "data"              "cluster"           "probabilities"
#>  [4] "centers"           "cost.function"     "nclusters"
#>  [7] "iterations"        "covariances"       "covariances.model"
#> [10] "time"