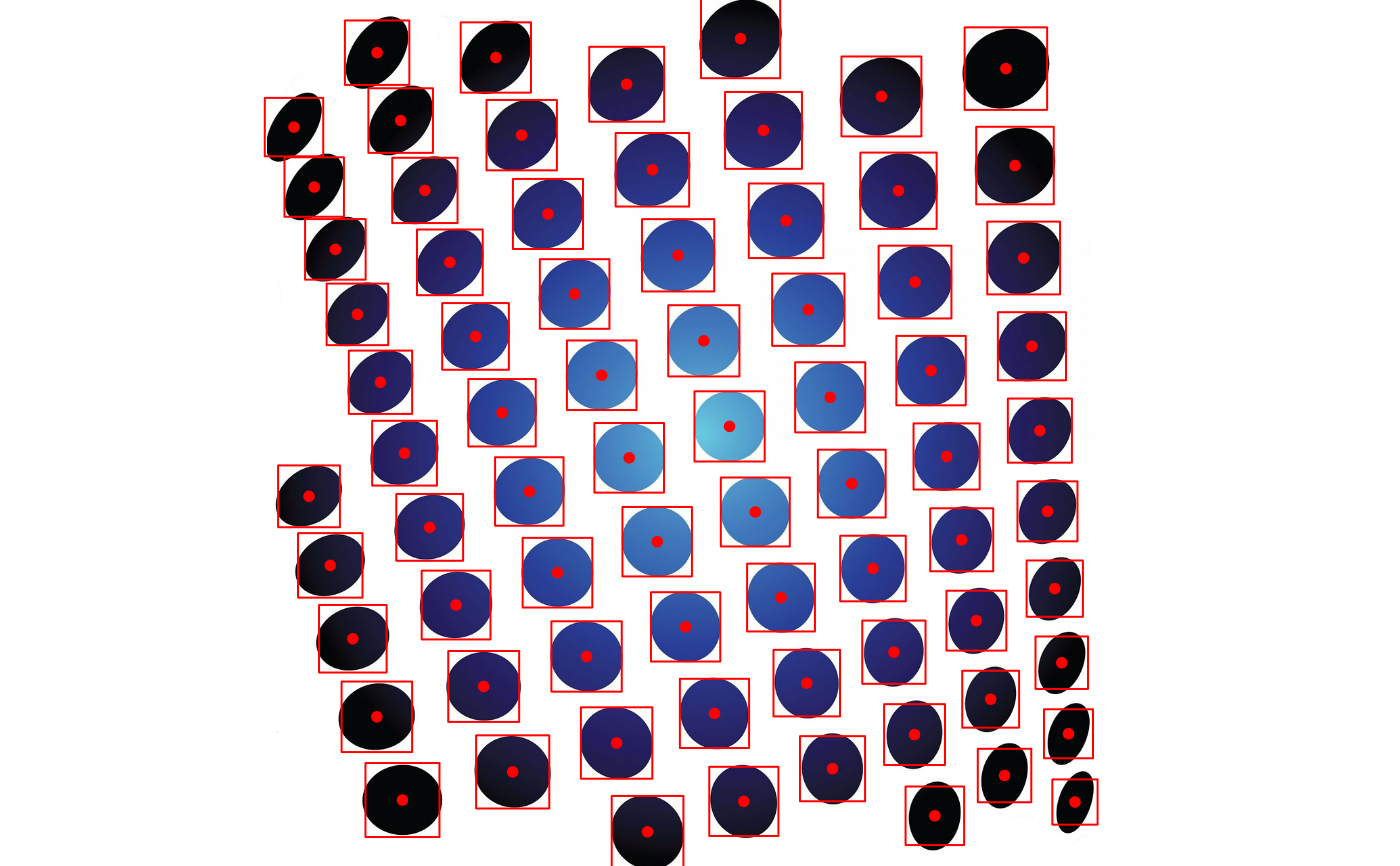
Plotting method for objects inheriting from class blob.
Usage
# S3 method for class 'blob'
plot(x, col = "red", asp = 1, ...)
Arguments
- x
A
blobobject.- col
The color of the
blobcenter and box (default: "red").- asp
The y/x aspect ratio of the plotting window (default: 1).
- ...
Additional arguments to be passed to
plot.
Author
Simon Garnier, garnier@njit.edu
Examples
dots <- image(system.file("sample_img/dots.jpg", package = "Rvision"))
blobs <- simpleBlobDetector(invert(dots), min_threshold = 25, max_threshold = 220,
                            filter_by_area = TRUE, min_area = 200, max_area = Inf,
                            filter_by_color = FALSE)
plot(dots)
plot(blobs, pch = 20)